This ranking looks at U.S. cities that are commonly cited in public crime-rate comparisons, with a focus on reported crime data rather than real-time personal safety. Crime rankings can shift depending on the year, agency participation, population denominator, and whether the list uses violent crime, property crime, or a combined measure. Use this article as a source-aware overview, not a live safety advisory or a substitute for checking current local data.
Data note: based on available public crime-rate reporting and source methodology, not real-time safety conditions.
Methodology and Source Notes
- Primary source lane: reported crime data and methodology from the FBI Crime Data Explorer.
- Context source: justice statistics and victimization context from the Bureau of Justice Statistics.
- Population context: city population checks should use the U.S. Census QuickFacts or current local population datasets.
- Why rankings vary: lists can differ when they use violent crime only, property crime only, combined rates, raw incident counts, different reporting years, or incomplete agency participation.
- How to read this: the ranking is a research-oriented snapshot for readers comparing urban risk context, not a claim that every neighborhood in a listed city has the same safety profile.
Quick Ranking Summary
- St. Louis, Missouri
- Detroit, Michigan
- Baltimore, Maryland
- Memphis, Tennessee
- Cleveland, Ohio
- Baton Rouge, Louisiana
- Milwaukee, Wisconsin
- Albuquerque, New Mexico
- Oakland, California
- Stockton, California
1. St. Louis, Missouri

- Primary concern: Violent crime and concentrated neighborhood-level risk.
- Data caveat: Citywide rates can mask sharp variation by neighborhood and reporting year.
- Urban context: Historic core, riverfront assets, and vacancy patterns create uneven safety and reinvestment conditions.
- Population note: Use Census population context when comparing per-capita rates across shrinking or growing cities.
St. Louis tops this list due to its consistently high rates of violent crime, impacting design priorities in the city’s most affected neighborhoods. Architects here must carefully balance robust security features, like reinforced entrances and surveillance integration, with community-focused aesthetics to avoid defensive architectures that alienate residents. Material selection often leans toward durable, vandal-resistant options, though this introduces cost and maintenance considerations. Caution is advised when engaging with historic properties in these areas, as renovation projects may require extensive updates for safety compliance without compromising architectural heritage.
2. Detroit, Michigan

- Primary concern: Violent crime, property crime, and long-term disinvestment patterns.
- Data caveat: Reported-crime comparisons can shift as police reporting practices and population estimates change.
- Urban context: Large land area, vacancy, redevelopment, and downtown reinvestment make citywide averages especially blunt.
- Population note: Population denominator changes can strongly affect rate-based rankings.
Detroit’s high crime rate has driven significant rethinking of urban design and housing renovation to bolster resident security and urban resilience. Due to widespread property crime and violent incidents, design strategies often incorporate gated community models and controlled access points. However, these features can limit permeability and community interaction, presenting tradeoffs between safety and social cohesion. Renovation efforts frequently contend with abandoned or deteriorated structures, demanding innovative interventions that prioritize crime deterrence alongside sustainability.
3. Baltimore, Maryland

- Primary concern: Violent crime and homicide-rate comparisons.
- Data caveat: Rankings should distinguish homicide, violent crime, and total reported crime.
- Urban context: Dense historic neighborhoods, port infrastructure, and uneven reinvestment shape block-by-block risk patterns.
- Population note: Use current Census and local open-data checks before treating one citywide rate as definitive.
Baltimore is notable for its violent crime clusters, challenging architects to embed safety within dense urban fabric and historic row houses. Effective design solutions emphasize visibility and natural surveillance, such as transparent fencing and lighting, while carefully considering the social implications of defensive design. Durable materials and multipurpose layouts support both residential and mixed-use developments. One caution is maintaining sensitivity to the architectural identity of the neighborhoods, as overly securitized designs risk undermining community character.
4. Memphis, Tennessee

- Primary concern: Violent crime and property crime in regional comparisons.
- Data caveat: Different lists may use city limits, metro areas, or specific crime categories.
- Urban context: A spread-out urban form and major transportation corridors can complicate citywide interpretation.
- Population note: Population and boundary choices matter when comparing Memphis with denser cities.
Memphis ranks high in violent and property crime rates, influencing architects to prioritize adaptive reuse and strategic renovations that reinforce security. Buildings often require upgrades including shatter-resistant glass, controlled entry points, and enhanced lighting. The tradeoff lies in balancing these structural enhancements with maintaining affordable housing stock and providing welcoming environments. Caution is necessary when selecting security measures to avoid creating fortress-like facades that may negatively impact neighborhood morale.
5. Cleveland, Ohio

- Primary concern: Violent crime, property crime, and concentrated urban distress.
- Data caveat: City rankings can change when using raw incidents versus per-capita rates.
- Urban context: Legacy industrial areas, lakefront redevelopment, and neighborhood vacancy create varied built-environment conditions.
- Population note: Population decline or growth can move rate rankings even when incident counts change modestly.
Cleveland’s crime statistics necessitate a focus on resilient residential design, with emphasis on both preventative and reactive architectural features. Innovations include increased window glazing security, perimeter defenses integrated into landscaping, and multi-unit designs that maximize natural monitoring. Material durability must be balanced with budget considerations, particularly in public housing contexts. Renovators should be aware of local building codes responding to crime trends, ensuring compliance with requirements that may affect design flexibility.
6. Baton Rouge, Louisiana

- Primary concern: Violent crime and public-safety comparisons among mid-sized cities.
- Data caveat: Mid-sized cities can rank high on per-capita measures even with fewer raw incidents than larger metros.
- Urban context: Government, university, river, and industrial districts produce varied activity patterns and risk profiles.
- Population note: Check population estimates and city-limit boundaries when comparing Baton Rouge with larger cities.
Baton Rouge combines elevated violent crime rates with rapid urban growth, resulting in complex demands on architectural design and material selection. Security-oriented layouts in new developments often incorporate buffer zones and controlled pedestrian pathways. The challenge is mitigating crime risk while fostering connectivity and open space access. Renovation projects frequently encounter issues like inadequate lighting and vulnerable entry points, necessitating strategic upgrades without overwhelming budgets.
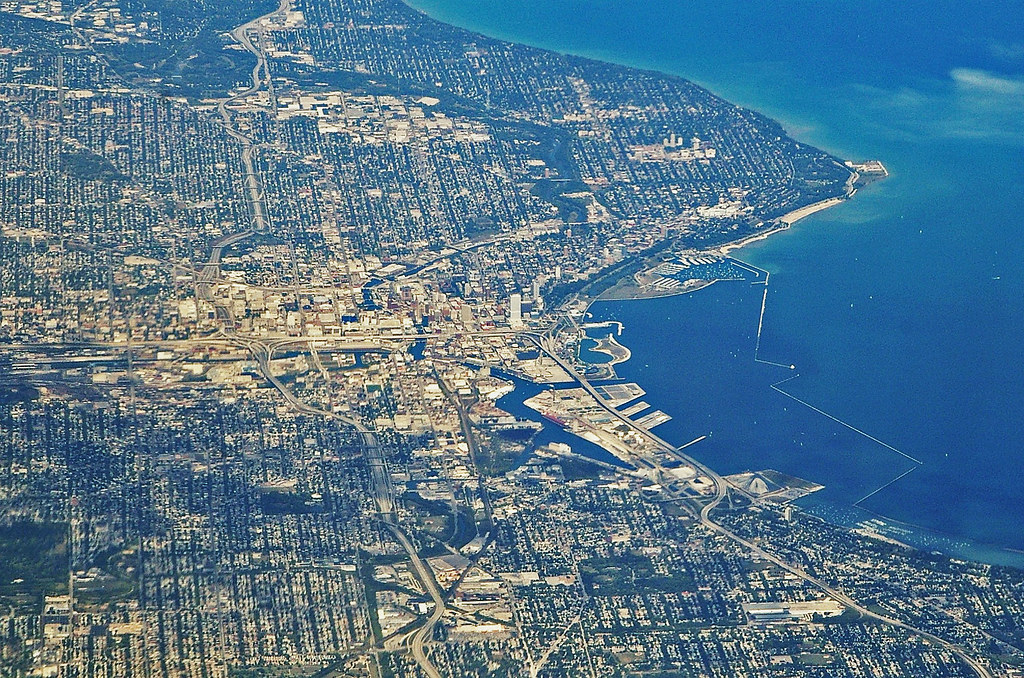
7. Milwaukee, Wisconsin
- Primary concern: Violent crime and neighborhood-level concentration.
- Data caveat: Reported citywide rates do not show which neighborhoods drive the ranking.
- Urban context: Lakefront redevelopment, historic housing stock, and concentrated disadvantage can coexist in the same citywide average.
- Population note: Population shifts can affect per-capita comparisons across older industrial cities.
Milwaukee's crime rates highlight the need for integrated security in diverse residential and commercial environments. Design strategies favor multi-layered security that includes natural surveillance, access control, and community engagement spaces. Material choices often prioritize resistance to vandalism alongside aesthetic quality. Architects should consider the implications of heavy security features in public spaces to avoid diminishing user comfort or accessibility.
8. Albuquerque, New Mexico

- Primary concern: Property crime, violent crime, and auto-theft-related comparisons.
- Data caveat: Some lists weigh property crime more heavily than violent crime, changing rank order.
- Urban context: A dispersed metro form and major travel corridors can affect how crime patterns are discussed.
- Population note: Per-capita rates should be checked against current Census population estimates.
Albuquerque faces challenges related to both violent and property crimes impacting urban design decisions. Security integration often involves careful placement of communal areas, lighting strategies, and barrier systems that do not disrupt neighborhood flow. Material selection favors maintenance-friendly options due to frequent repairs in problem areas. Caution arises in balancing protective elements with maintaining inviting urban streetscapes to support revitalization efforts.
9. Oakland, California

- Primary concern: Violent crime, property crime, and regional cost-pressure context.
- Data caveat: City comparisons can be distorted by using city limits instead of broader metro patterns.
- Urban context: Port activity, dense neighborhoods, transit corridors, and rapid real-estate change create varied urban conditions.
- Population note: Population and commuting patterns matter when interpreting per-resident crime rates.
Oakland’s high crime rates in specific districts have driven architects to explore creative incorporation of security in mixed-use and residential projects. Reinforced materials and smart surveillance systems are increasingly common, though these raise tradeoffs between cost, aesthetics, and privacy. Design must adapt to varying neighborhood contexts requiring tailored approaches to perceived and actual safety concerns. Renovators especially need to address vulnerabilities in older structures to meet current security expectations.
10. Stockton, California

- Primary concern: Violent crime and property crime among California cities.
- Data caveat: Rankings should verify whether the source uses recent reported data or older multi-year averages.
- Urban context: Central Valley growth, commuting patterns, and uneven neighborhood investment shape local context.
- Population note: Population growth can change per-capita rates even when incidents move differently.
Stockton rounds out the list with substantial crime-related design challenges tied to economic and urban development pressures. Architectural responses include fortified building envelopes and site planning that maximizes visibility. However, increased security can conflict with goals for vibrant public interaction and affordable housing provision. Renovation work needs to focus on upgrading infrastructure and security systems without pricing out existing communities or reducing architectural character.
Frequently Asked Questions
- How do crime rates affect architectural design?
- Higher crime rates influence choices in materials, layouts, and security systems to enhance safety while balancing aesthetics and community needs.
- What are common security features used in high-crime urban areas?
- Common features include reinforced doors and windows, surveillance systems, controlled access points, enhanced lighting, and natural surveillance through design.
- Can architectural design help reduce crime?
- While design alone cannot prevent crime, strategies like Crime Prevention Through Environmental Design (CPTED) can reduce opportunities for crime and increase perceived safety.
Understanding the top 10 most dangerous cities in the US by crime rate offers valuable insights for architecture professionals and renovators working within challenging urban settings. Each city's unique crime profile informs specific design considerations—from material resilience and security integration to maintaining community identity. Balancing safety measures with aesthetics and functionality requires nuanced approaches tailored to local conditions and socio-economic factors. In high-crime environments, architecture plays a pivotal role in shaping safer, more livable neighborhoods without sacrificing architectural integrity or inclusivity.
For more room-by-room ideas, browse Architecture Adrenaline’s latest design guides and save your favorite looks for your next project.